

The Morning Hedge newsletter runs data on all markets to find what is the optimal date range that statistically is the most profitable on an individual market. Wouldn’t you like to know what the most profitable 3 days in Gold Futures for this month are? How about an area we could notify if there is profit taking you may want to do within your own account, or better a 1 day hold time in a stock you have been wanting to quickly trade. We’re allowing you to have this type of hedge fund access to literally “hedge” your own portfolio or advisor. These “edges” we find are not known by all, and the way we filter out randomness and seek trending markets, helps you the most. Please take a minute to read more below.
In the realm of finance, having a trading edge means one has a short-term superiority over others trading in the same market. This edge can take numerous forms, with the two most prominent being information edge and price edge.
An advantage over the other market participants would be having access to insider trading or non-public material information. For instance, one example would be being aware of a significant agreement that will boost sales prior to others in the market.
A picture depicting billions of days of trading on the information edge can be seen below.

When it comes to trading, a more frequent approach is to gain an advantage through research and data analysis. Quantitative technical analysis or recognizing that when prices reach a certain point, they have often been profitable in the following N days, can create a benefit.
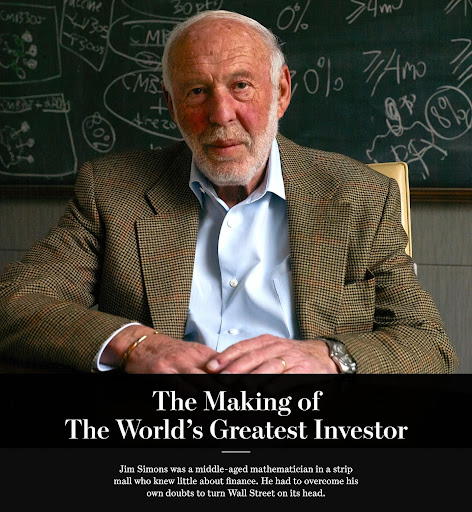
According to Renaissance Technologies, which is considered the greatest hedge fund ever, that is the approach they use.
The aim of Renaissance is to anticipate future trends in financial instruments through statistical models. They look for any irregularity in price movements that could be taken advantage of; these are referred to as “signals”. The company then devises trading models that fit the acquired data. Source: The Secret World of Jim Simons | Institutional Investor
No matter what type of trader you are, whether it is a swing trader or a day trader, it is essential for them to have an advantage. Having an edge in trading is critical when it comes to the stock market, forex trading, futures markets, crypto, etc.
It is impossible to attain success in trading without having the capability to determine an advantage and handle risk, which will always be possessed by other traders.
A trading edge is illustrated by what example?
Having an information advantage in the stock market, such as being aware of a company’s quarterly numbers or merger and acquisition news before it is released to the public, is not an activity that is legal. Nonetheless, this has been a long-standing practice in the stock market.
Trading edge that is based off of price is one of the top approaches to take and is entirely permissible. This involves buying or selling at a rate that is usually much cheaper than what is seen in other markets or in comparison to its usual behaviour. It is possible to quantify this type of edge and this post will be focused on it.
The Trading Edge Formula
This particular technique offers an approach to trading that can be used to gain an advantage.
In brief, edge is an expectation of gain. How do we measure this expectation and what is it?
The anticipated gain that a trader can expect if they executed an infinite number of similar trades is known as expected value. This is often referred to as EV in shorthand. It is mathematically defined as the sum of all potential results multiplied by the likelihood of each result occurring. EV is the most elementary type of trading advantage.
The expected value of a bet can be calculated by multiplying the probability of success by the potential gain, and then subtracting the probability of failure multiplied by the amount that could be lost.
If the expected value (EV) is a negative number, it would not be advisable to make the trade. A high win rate is not necessary if the potential gains are large in comparison to any potential losses (which is the concept behind trend following).
It is essential to consider both win rate and risk:reward when trading. Many traders tend to neglect one or the other. The graph below is an excellent way to understand the correlation between the two.
The accompanying chart gives a visual representation of the positive expectancy of $1 risk. If the reward is found to be 2.5, it means that for every $1 that is risked, there is a gain of $2.5 and a loss of $1.
Traders who have been around for a while may find that their trading efforts yield higher returns when using a 50% win rate strategy with a 2:1 risk:reward ratio, compared to a trader who has an accuracy rate of 70% but only utilizes a 1:1 risk:reward.
To help us comprehend expected value, let’s consider a coin-toss game that has two possible scenarios:
- When it comes to the toss of a coin, heads are the result 90% of the time and you receive $1.
- Tails occur the remaining 10% of the time and you lose $10 in this case.
The impact of technology on our lives is undeniable. It has changed the way we communicate, work, and even entertain ourselves. There is no doubt that it has had a strong and profound effect on our day-to-day existence.
Technology has had an indubitable influence on our daily lives.
Communication, labor, and leisure have been altered by its presence. Its effects on society have been immense and far-reaching.
Different phrasing can be used to avoid plagiarism while still conveying the same message. This is done by altering the structure of the text without altering the overall meaning. Keeping the original context intact is essential to ensure the meaning remains unchanged.
Are you interested in this game? Most beginner stock traders are attracted to the prospect of a 90% success rate. But, the EV for this particular activity is not beneficial! The math works out to be 90% x $1 + 10% x -$10 = -$0.10. To be successful, the edge has to have a positive expectancy.
A vital teaching is that even if you are successful 90% of the time, you can still find yourself losing money! Remember, it is highly unlikely you will actually win 90% of the time.
Are you looking for an advantage in trading?
It is true that if a person lacks an advantage, they are trading without any structure and it is impossible to successfully do that as there are associated expenses and randomness can lead to a downward trend in performance. The majority of traders and their respective strategies are unsuccessful due to the lack of knowledge and/or an edge.
It is essential for inexperienced traders to comprehend that they cannot be profitable without quantifying their edge to determine if it has a long-term, across-the-board advantage in terms of price and timeframe. Most traders are unaware of this, as they have not completed this process.
A starting point is necessary to measure an edge, which is where e-ratio (edge ratio) comes in.
How is Edge Ratio Defined?
The Edge Ratio is a numerical measure of how much the price has moved in a favorable direction as compared to how much it has moved in the opposite direction. It gauges the advantage of the trade for the trader by quantifying their trading edge.
In this article, I will give a brief overview of the concept of Edge Ratio in Automated Trading, which I have delved into in greater detail elsewhere.
It is possible to graph e-ratio by plotting the bars from the entry on the X-axis and the degree of favorability or unfavorability of the trade on the Y-axis.
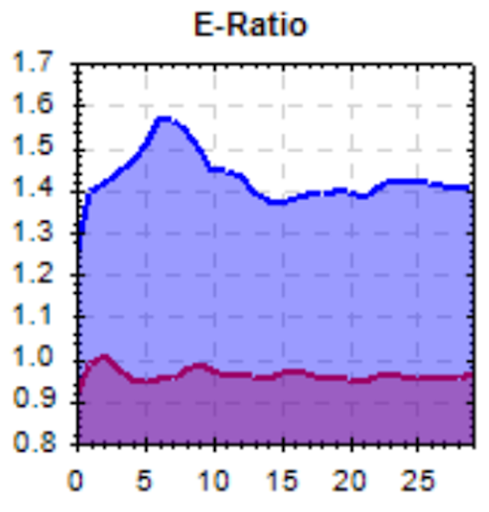
The blue edge ratio serves as an indicator for trading signals, and the red edge ratio is used as a reference for randomly generated trading signals.
The blue line in the image displays that the most edge is found six bars into the trade, and the edge ratio is about 1.6.
This implies that there is an advantage of 0.6 units of volatility in comparison to the unfavorable volatility.
A signal or entry with an edge ratio of less than 1.0 is comparable to a random selection made by a monkey throwing darts; thus, trading it would be of no benefit.
How long is a trading advantage sustainable?
By utilizing edge ratio, or eratio, we can identify when a trading edge starts to weaken. Understanding the edge ratio of an algorithmic trading system or any entry will aid you in selecting the best exits and when it is time to abandon the trade.
The eratio image clearly demonstrates that after six bars of holding, the trading edge begins to wane. Therefore, the most beneficial time to exit is right at six bars, when the trading edge is at its strongest.
Having a Higher Number of Profitable Trades than Unprofitable Trades does not Prove an Advantage
Retail investors create a trading plan, adjusting the parameters until the past performance appears to be highly successful. This method of trading frequently produces strategies that appear to be very advantageous in hindsight, but have very poor results in real-time trading.
When trading, it is important for an individual to find strategies that can stand the test of time and various market conditions. A backtest that shows more wins than losses, yet has a negative or stagnant e-ratio, is often indicative of overfitting. Before you start trading, make sure to check the e-ratio to see if there is actually an edge that can be taken advantage of, rather than just luck.
Strategies to Illustrate Trading Advantages
Quantifying the edge for algorithmic trading with Edge Ratio is the most accurate method, however, there are several other techniques to represent the trading edge worth considering.
Heat Map Representation
A heat map is a graphical representation of data where the individual values contained in a matrix are represented as colors. This provides an easy way to visualize complex data. It is used to analyze the data and identify underlying patterns and relationships that may not be immediately obvious.
We can chart the progress of each individual trade from the time of entry by plotting the forward returns on an x-axis. The y-axis will indicate each trade. Green shades indicate the profitability of the return at each bar. Comparing the heat maps of two different signals will make it easier to determine which one is more profitable.
A heatmap specifically designed for traders can be seen in the image above. The image shows a visual representation of the market, which can be used to make informed decisions about trades and investments.
A Graph Depicting Return on Investment
The equity curve is a graphical representation of the profits and losses over a given period of time. It is used to show the cumulative gains and losses of a particular investment. This tool allows investors to quickly assess the performance of their investments and make informed decisions about their investments. It is an effective way to track the performance of a portfolio and make decisions on where to allocate resources.
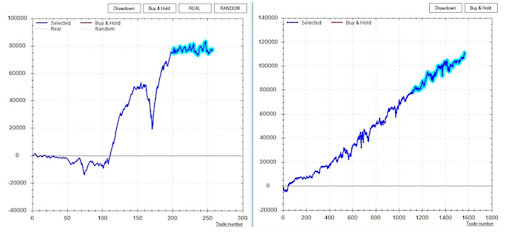
An equity curve is a graphical representation of the cumulative profits or losses of a trading system over a period of time. It serves as an indicator of the success or otherwise of a strategy which has been employed. Generally, it is evident which strategies are the most effective.
The below image presents a strategy of Equity Curve Mean Reversion.
Different Types of Distribution
Distributions are a range of values that occur in a set of data. They can be visualized in various ways, such as graphs or tables, to show the spread of the values. Knowing the distribution of a given set of data can be useful for understanding how the data is related and can also help to inform decisions regarding the data.
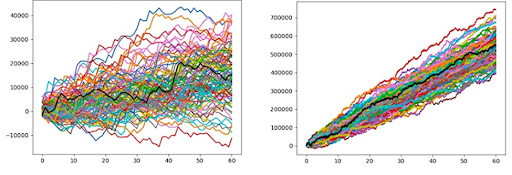
One can gain more knowledge than just a heatmap or equity curve by examining all the potential consequences of a plan. We can utilize statistical tests, such as Monte Carlo Simulation and Analysis, to understand what could be. This can be thought of as a way to comprehend how an algo trading approach would act in universes where the price info was like the one I experienced, but not precisely the same.
What would you like to see as the outcome of 50 trades? Different strategies can lead to negative or positive results; the right-hand side offers positive P&L. Furthermore, if market conditions change, the right-side trading system can act as a safeguard.
A depiction of the probability distributions for mean reversion strategies is presented in the following image:
Achieving Success in Trading
The key to success in trading is to remain one step ahead of the competition. By having a strong edge in the market, you can make accurate predictions and stay ahead of the curve. This edge can come from understanding the fundamentals behind the markets, utilizing technical analysis, or through the use of algorithmic trading strategies. All of these methods can help you gain an advantage in the markets and keep you one step ahead of the competition.
It’s not certain that every transaction we make will be successful; there is not a single, foolproof trading advantage. Having an advantage and following it with discipline is the greatest benefit we can have in trading. We can measure edge with edge ratio, which is one method to rate our trading plans. We should invest more money into those strategies with a larger advantage instead of ones with a less powerful edge.
By using ensemble strategies, it is feasible to combine weaker edges in order to generate stronger ones. An article about these methods and approaches is available.
Gaining a mental edge in trading to enhance success in trades
Gaining a mental advantage can be a form of an edge when trading. Traders have been led to believe that intraday trading and utilizing a trading diary can develop a mental edge. Nonetheless, a mental edge should be thought of as an extra benefit rather than a single edge!
It is impossible to be profitable if one has a mental edge but does not possess a price edge. A mental edge in trading means having the mental fortitude to stay disciplined and to carry out the plans to exploit a price edge as often as possible.
Having psychological strength or mental discipline does not give an advantage in price, but executing randomly with an even-keeled demeanor is still important. Trading is only successful when both mental and price edges are combined.
Gaining an advantage mentally can be made easier by employing automation and algorithms. Taking advantage of automation is the most straightforward way of guaranteeing that your pricing advantage is put into action in a predictable manner each time the advantage presents itself. To acquire more information on algorithmic trading, please visit this thorough guide: Algorithmic Trading Guide.
Acquiring the Advantage in Trading, Profiting from Deals, and the Principle of Averages
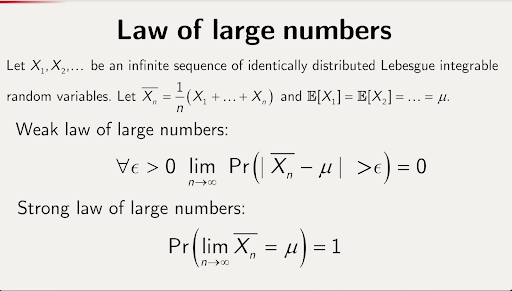
In the immediate future, almost anything could happen. Over the long haul, however, the results begin to align with their anticipated outcome (which is our trading edge). This mathematical concept is referred to as the law of large numbers.
A depiction of the Law of Large Numbers can be seen in the following image:
Traders often come up short because they are constantly in search of the newest and most attractive technique. This phenomenon is commonly referred to as “strategy hopping”.
The unfortunate path that many traders take: they first discover a method that works for a period of time, but then as it begins to fail they must either adjust it or find a fresh approach.
The original plan is altered when either option is selected, and this new or modified plan performs well during actual trading for a period of time. Ultimately, however, one must decide between further alteration of the strategy or the search for a different, attractive approach.
Traders make the mistake of not giving any approach the opportunity to be seen through to completion. This keeps them in a cycle of short-term unpredictability!
An example of short-term uncertainty and long-term predictability is to analyze a coin tossing game over an extended period of time. Fair coins should theoretically result in heads 50% of the time. But, in small experiments, the numbers are significantly different. For instance, 30 tosses resulted in a 73% heads rate, while two other 30 toss experiments yielded 43%.
An illustration of thirty coin flips is presented as a metaphor for the stock market. A depiction of a series of coin tosses is used to represent the volatility of stock market prices.
As the number of coin tosses grows, the ratio of heads to tails approaches the expected value of 50%. The law of large numbers is beginning to have a noticeable effect!
An illustration of a hundred coin flips is depicted in the image above, which symbolizes the unpredictability of the stock market.
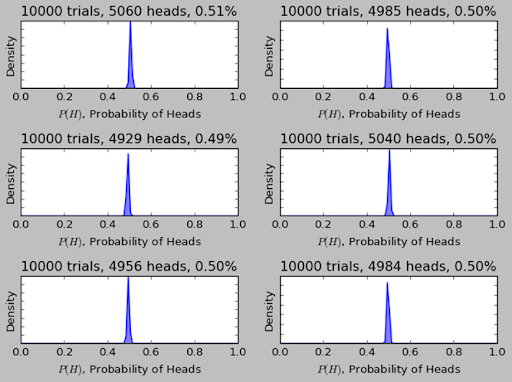
When 10,000 virtual coin flips are conducted, the results will nearly always be split evenly. The law of large numbers guarantees that this will be the case if conditions remain the same.
An image depicting 10,000 coin flips that can be compared to the stock market can be seen below.
An Illustrative Instance of the Law of Large Numbers in Trading
The equity curve of this algorithmic strategy has been incredibly smooth, which is something many investors strive for. On average, the algo system made a profit of $170 per trade.
Initially, when our belief in the trading system is the weakest, we observe a turbulent trading journey and it’s far from the $170 per trade benefit that is achieved eventually. It takes an immense amount of trades for the average trade to reach its true average!
Many dealers find it hard to handle this randomness that comes with short-term trading, and they eventually switch to another concept, indicator, or “holy grail” strategy.
Those who are victims of constantly changing strategies never allow themselves to benefit from the advantages and, unfortunately, never succeed. If you recognize this behavior in yourself, it’s best to stay on the practice account! This type of decision-making often goes unnoticed by other traders and takes a while to master.
My mentor elucidated the idea of short-term randomness and long-term obviousness for me, whereupon I immediately understood it. The key is to invest time for a greater edge.
The ideal name for the Chat with Traders podcast I participated in was Escaping Randomness. In the episode, I discussed strategies to combat randomness and how algorithmic trading can be beneficial to traders, allowing them to approach risk-taking and edge more productively. If you haven’t already, please check out Aaron’s great work here: Escaping Randomness with David Bergstrom.
Exploring Strategies and Illustrative Trading Concepts
This article is not complete without mentioning some basic trading edges and where to initiate your quest to discover approaches for your own trading edges and limit your own potential losses.
Trading at various times of the day
For more than 15 years, the S&P500 has been a lucrative choice for day traders from 2 to 3 AM ET. This is just one example of how many stocks and commodities have demonstrated consistent time of day patterns.
At 2:00 AM ET, traders can purchase a single agreement in the e-mini S &P 500, and then sell it an hour later.
Seasonal Variability
It is a fact that throughout the course of the year, there are variations which can be noticed in different elements, such as temperature, weather, and daylight hours. This phenomenon is known as seasonality, and it affects a range of things from the environment to the economy.
From year to year, it is possible to observe consistent patterns in the price movement of many stocks during the same days of the calendar.
Analyzing Prices Movements
When attempting to locate a trading advantage, exploring bar designs and evaluating prices can be advantageous. Nevertheless, it is essential to conduct a thorough investigation and test. Do not be persuaded by industry terms like Bearish Engulfing. You can learn more about trading “truths” here: buildalpha.com/3-trading-truths-tested/.
Estimating Worth
The act of assessing the worth of something in comparison to something else is known as relative value.
In order to gain a competitive edge, it can be advantageous to compare one asset to another. This is especially useful for non-directional traders, pair traders, and relative value traders as they can benefit from trades in numerous markets.
Data That Is Different
Exploring other data sources such as market breadth, economic figures, differences in interest rates, Vix term structure, and options flows can provide extra benefits for optimizing your portfolio.
Build Alpha offers a range of other data signals that can be accessed
Utilizing Build Alpha to improve Trading Performance
Alpha Build permits users to impose entry signals that the program is obligated to incorporate in every tactic generated by the genetic algorithm. Furthermore, traders can choose from thousands of additional non-mandatory signals to go along with any obligatory signals. Subsequently, this process will determine the most appropriate additional signals for the obligatory trading signals. This can easily and quickly augment a known advantage.
In addition, Build Alpha offers a variety of options to display the trading advantage of any plan, such as e-ratio, Monte Carlo distributions, equity curves and heat maps.
To finish off, no strategy is finalized until it has gone through stress testing. Build Alpha provides an extensive selection of reliability exams and assessments for algorithmic trading techniques. Evaluating the strength of a strategy is a step of its own as many do not survive in actual markets.
You can find our complete guide to Robust Trading Strategies at the following link: Robust Trading Strategy Guide.
Essential Information Concerning Trading Edges
- Having an advantage in the market is essential for achieving success in trading
- Gaining an informational advantage is generally prohibited. The most successful traders rely on price edge
- Calculating Expected Value and having positive expectancy is often an excellent starting point in evaluating edge
- Edge Ratio provides the best means of measuring the edge and risk
- Allow your market edge to play out in the long run. The Law of Large Numbers requires time to be profitable.
- There are various forms of trading edge which comprise of time of day, price action and alternative data
- Building Alpha algorithmic trading software can expedite the search for edge.
It is possible to avoid plagiarism by restructuring the text while still retaining the same context and meaning. This can be done by altering the words used, rearranging the sentence structure, and changing the overall formatting of the passage.
The use of technology has dramatically altered the way we live, work, and communicate with one another. Today, it’s almost impossible to imagine life without the convenience that comes with having access to the latest digital advances. Our daily routines have been revolutionized, making tasks simpler and far more efficient. Interaction between people has also been impacted, with communication now taking place at a much faster and more convenient pace.